
10 Essential Trading Strategies Every Crypto Trader Should Know
August 21, 2025
How to Manage Risk and Protect Your Investments in Volatile Markets
August 21, 2025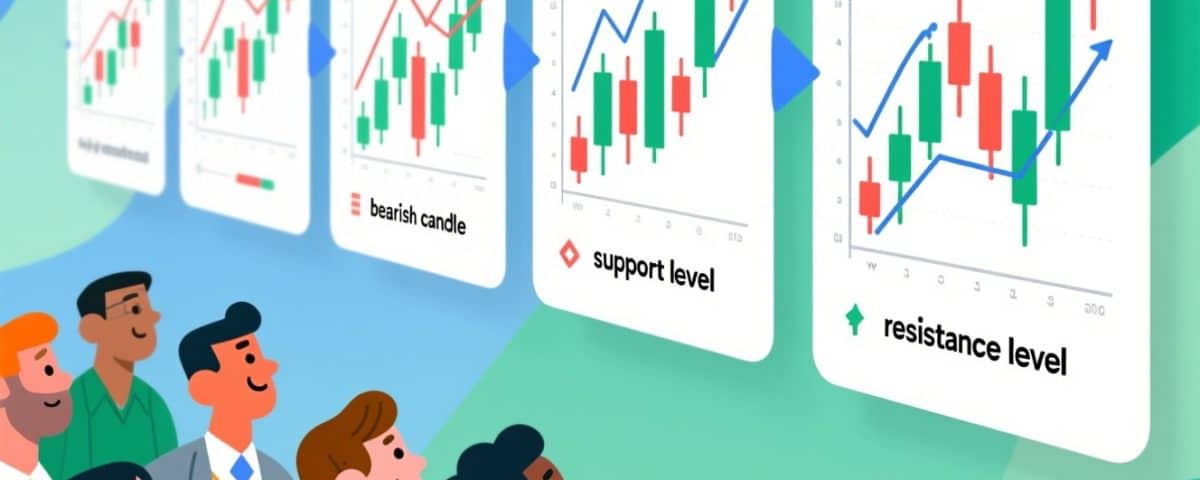
Diving into cryptocurrency trading can feel overwhelming, especially when you’re staring at a screen full of charts, numbers, and lines. But don’t worry—learning to read crypto charts is like learning a new language, and with practice, it becomes second nature. This beginner-friendly guide will walk you through the process step-by-step, helping you understand price movements and make smarter trading decisions. We’ll also show you how to use the Exbix Exchange trading dashboard to apply these skills in real-time, with its intuitive interface and support for over 100 trading pairs like BTC/USDT.
What Are Crypto Charts?
Crypto charts are like a window into the market, showing how a cryptocurrency’s price changes over time. For example, the BTC/USDT pair tracks Bitcoin’s value against Tether, a stablecoin pegged to the U.S. dollar. These charts help you spot trends, predict price movements, and decide when to buy or sell.
The Exbix Exchange trading dashboard is a great place to start. It offers real-time candlestick charts, technical indicators, and a user-friendly design that supports over 90 languages, making it perfect for beginners and pros alike.
Here’s what we’ll cover:
- Getting familiar with crypto chart basics
- Picking the best chart type
- Decoding price and volume data
- Spotting trends and patterns
- Using technical indicators
- Exploring the Exbix Exchange trading dashboard
- Top tips for new traders
Step 1: Getting Familiar with Crypto Chart Basics
Crypto charts show how a cryptocurrency’s price moves over a chosen time period. The most popular type is the candlestick chart, which packs a ton of info into each “candle,” showing the opening, closing, high, and low prices for a specific time frame (like 1 hour or 1 day).
Key Parts of a Crypto Chart
- Price Axis (Y-Axis): This shows the crypto’s price in the trading pair, like BTC priced in USDT.
- Time Axis (X-Axis): This tracks time, from minutes to months, depending on your settings.
- Candlesticks: Each candle represents a time period and includes:
- Open: The price when the period started.
- Close: The price when the period ended.
- High: The highest price during the period.
- Low: The lowest price during the period.
- Volume Bars: Found below the chart, these show how much of the crypto was traded in that period.
On the Exbix Exchange trading dashboard, you’ll see a clean candlestick chart for BTC/USDT. You can zoom in or out to focus on different time frames, making it easy to analyze price action.
Step 2: Picking the Best Chart Type
There are a few types of crypto charts, each with its own strengths:
- Candlestick Charts: The go-to for most traders because they show detailed price action.
- Line Charts: Simple, showing only the closing price over time—great for spotting long-term trends.
- Bar Charts: Like candlesticks but less visual.
- Heikin-Ashi Charts: A smoothed-out version of candlesticks, useful for identifying trends.
For beginners, candlestick charts are the way to go because they’re packed with info and easy to read. The Exbix Exchange trading dashboard defaults to candlestick charts, so you can jump right in and start exploring BTC/USDT price movements.
How to Pick a Chart on Exbix
- Head to the Exbix Exchange trading dashboard.
- Find the chart settings (usually above the chart).
- Select “Candlestick” to start analyzing price data like a pro.
Step 3: Decoding Price and Volume Data
Reading Candlesticks
Each candlestick tells you what the market was up to during a specific time frame. Here’s the breakdown:
- Green (Bullish) Candle: The price closed higher than it opened—buyers were in control.
- Red (Bearish) Candle: The price closed lower than it opened—sellers took over.
- Wicks (Shadows): The thin lines above and below the candle show the highest and lowest prices during the period.
For example, on the Exbix Exchange trading dashboard, a green 1-hour candle means Bitcoin’s price climbed during that hour, while a red one means it dropped.
Understanding Volume
Volume bars, shown below the chart, tell you how much crypto was traded in a given period. High volume means lots of market activity, which can back up a price move or hint at a reversal. For instance:
- High volume during a price surge suggests strong buying interest.
- High volume during a price drop points to heavy selling.
The Exbix Exchange trading dashboard includes volume bars, so you can quickly see how active the BTC/USDT market is.
Step 4: Spotting Trends and Patterns
Trends
A trend is the overall direction of a crypto’s price. There are three main types:
- Uptrend: Prices keep climbing, with higher highs and higher lows.
- Downtrend: Prices are falling, with lower highs and lower lows.
- Sideways Trend: Prices bounce around in a range, with no clear direction.
To spot trends on the Exbix Exchange trading dashboard:
- Zoom out to a longer time frame, like 1 day or 1 week.
- Look for a pattern of higher highs and lows (uptrend) or lower highs and lows (downtrend).
- Use the dashboard’s drawing tools to sketch trendlines connecting highs or lows.
Common Chart Patterns
Chart patterns can give you clues about where the price might go next. Here are a few to know:
- Double Top/Bottom: The price hits a high or low twice before reversing—a sign of a trend change.
- Head and Shoulders: A reversal pattern that often signals a shift from uptrend to downtrend (or vice versa).
- Triangles: These show the price tightening into a range (ascending, descending, or symmetrical) before a breakout.
With Exbix’s drawing tools, you can mark these patterns right on the BTC/USDT chart to plan your trades.
Step 5: Using Technical Indicators
Technical indicators are tools that crunch price and volume data to predict future price moves. Here are three beginner-friendly ones:
1. Moving Averages
- Simple Moving Average (SMA): Averages closing prices over a set period (e.g., 50 days).
- Exponential Moving Average (EMA): Puts more weight on recent prices for quicker reactions.
- How to Use: A short-term moving average (e.g., 20-day) crossing above a long-term one (e.g., 50-day) is a bullish signal. The reverse is bearish.
2. Relative Strength Index (RSI)
- RSI measures price momentum on a 0–100 scale.
- Overbought (Above 70): The price might be too high and ready to dip.
- Oversold (Below 30): The price might be too low and due for a bounce.
3. Bollinger Bands
- These include a middle line (SMA) and two outer bands that track volatility.
- Prices hitting the upper band may signal overbought conditions; hitting the lower band may signal oversold conditions.
You can add these indicators to the BTC/USDT chart on the Exbix Exchange trading dashboard via the indicator menu. Play around with the settings to see what fits your style.
Step 6: Exploring the Exbix Exchange Trading Dashboard
The Exbix Exchange trading dashboard is built to make trading straightforward, even for newbies. Here’s how to get the most out of it:
- Visit the Dashboard: Go to the BTC/USDT trading pair via the Exbix Exchange trading dashboard.
- Check Out the Chart: You’ll see a real-time candlestick chart with options to switch time frames (1 minute, 1 hour, 1 day, etc.).
- Add Indicators: Use the indicator menu to apply RSI, moving averages, or Bollinger Bands.
- Watch the Order Book: This shows buy and sell orders, giving you a sense of market demand and supply.
- Make Trades: Use the buy/sell panel for spot or futures trades. Exbix’s perpetual futures are great for advanced strategies.
- Explore Extras: Check out staking and airdrop programs to earn rewards while you learn.
With support for 90+ languages and 24/7 customer service, Exbix is a welcoming platform for traders worldwide.
Step 7: Top Tips for New Traders
- Try a Demo Account: Practice reading charts and trading without risking real money. Exbix often offers demo accounts for this.
- Start Small: Use short time frames (like 5-minute or 15-minute charts) to see price action in real-time.
- Keep a Journal: Jot down your chart observations, trades, and what you learn to improve over time.
- Don’t Overdo Indicators: Stick to one or two at first to keep things simple.
- Stay Updated: Crypto prices can swing based on news. The Exbix Exchange trading dashboard may include market updates to keep you in the loop.
Why Exbix Exchange?
The Exbix Exchange trading dashboard is a fantastic tool for learning and trading. Here’s why it stands out:
- 100+ Trading Pairs: Trade popular pairs like BTC/USDT and more.
- Easy-to-Use Interface: Clear charts and tools make it beginner-friendly.
- Global Access: Supports over 90 languages for traders worldwide.
- Extra Features: Dive into futures, staking, and airdrops for more opportunities.
- Secure and Supported: Enjoy safe trading with 24/7 customer support.
By practicing on Exbix, you can build your chart-reading skills while exploring a platform designed for success.
Wrapping Up
Reading crypto charts is your key to unlocking smarter trading decisions. By mastering candlesticks, volume, trends, patterns, and indicators, you’ll be better equipped to navigate the crypto market. The Exbix Exchange trading dashboard makes it easy to put these skills into action with its real-time charts, user-friendly tools, and features like futures and staking.
Start small, experiment with the dashboard, and practice regularly. Whether you’re analyzing BTC/USDT or exploring other pairs, Exbix has everything you need to grow as a trader. Get started today and take your first step toward mastering crypto trading!